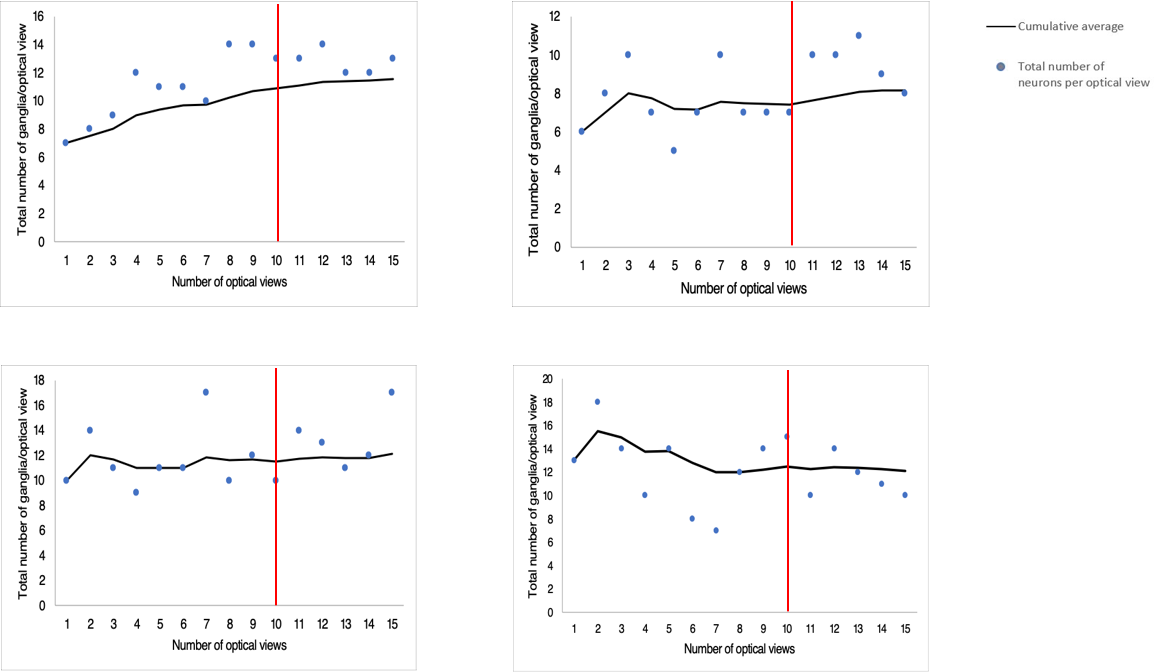
Fig. S3 Determination of optical view number at 10X magnifica‐ tion. The cumulative average of the total number of ganglia at 10X magnific‐ ation flattens at approximately 10 optical views in each pilot tissue. The red line represents where the cumulative average flattens.