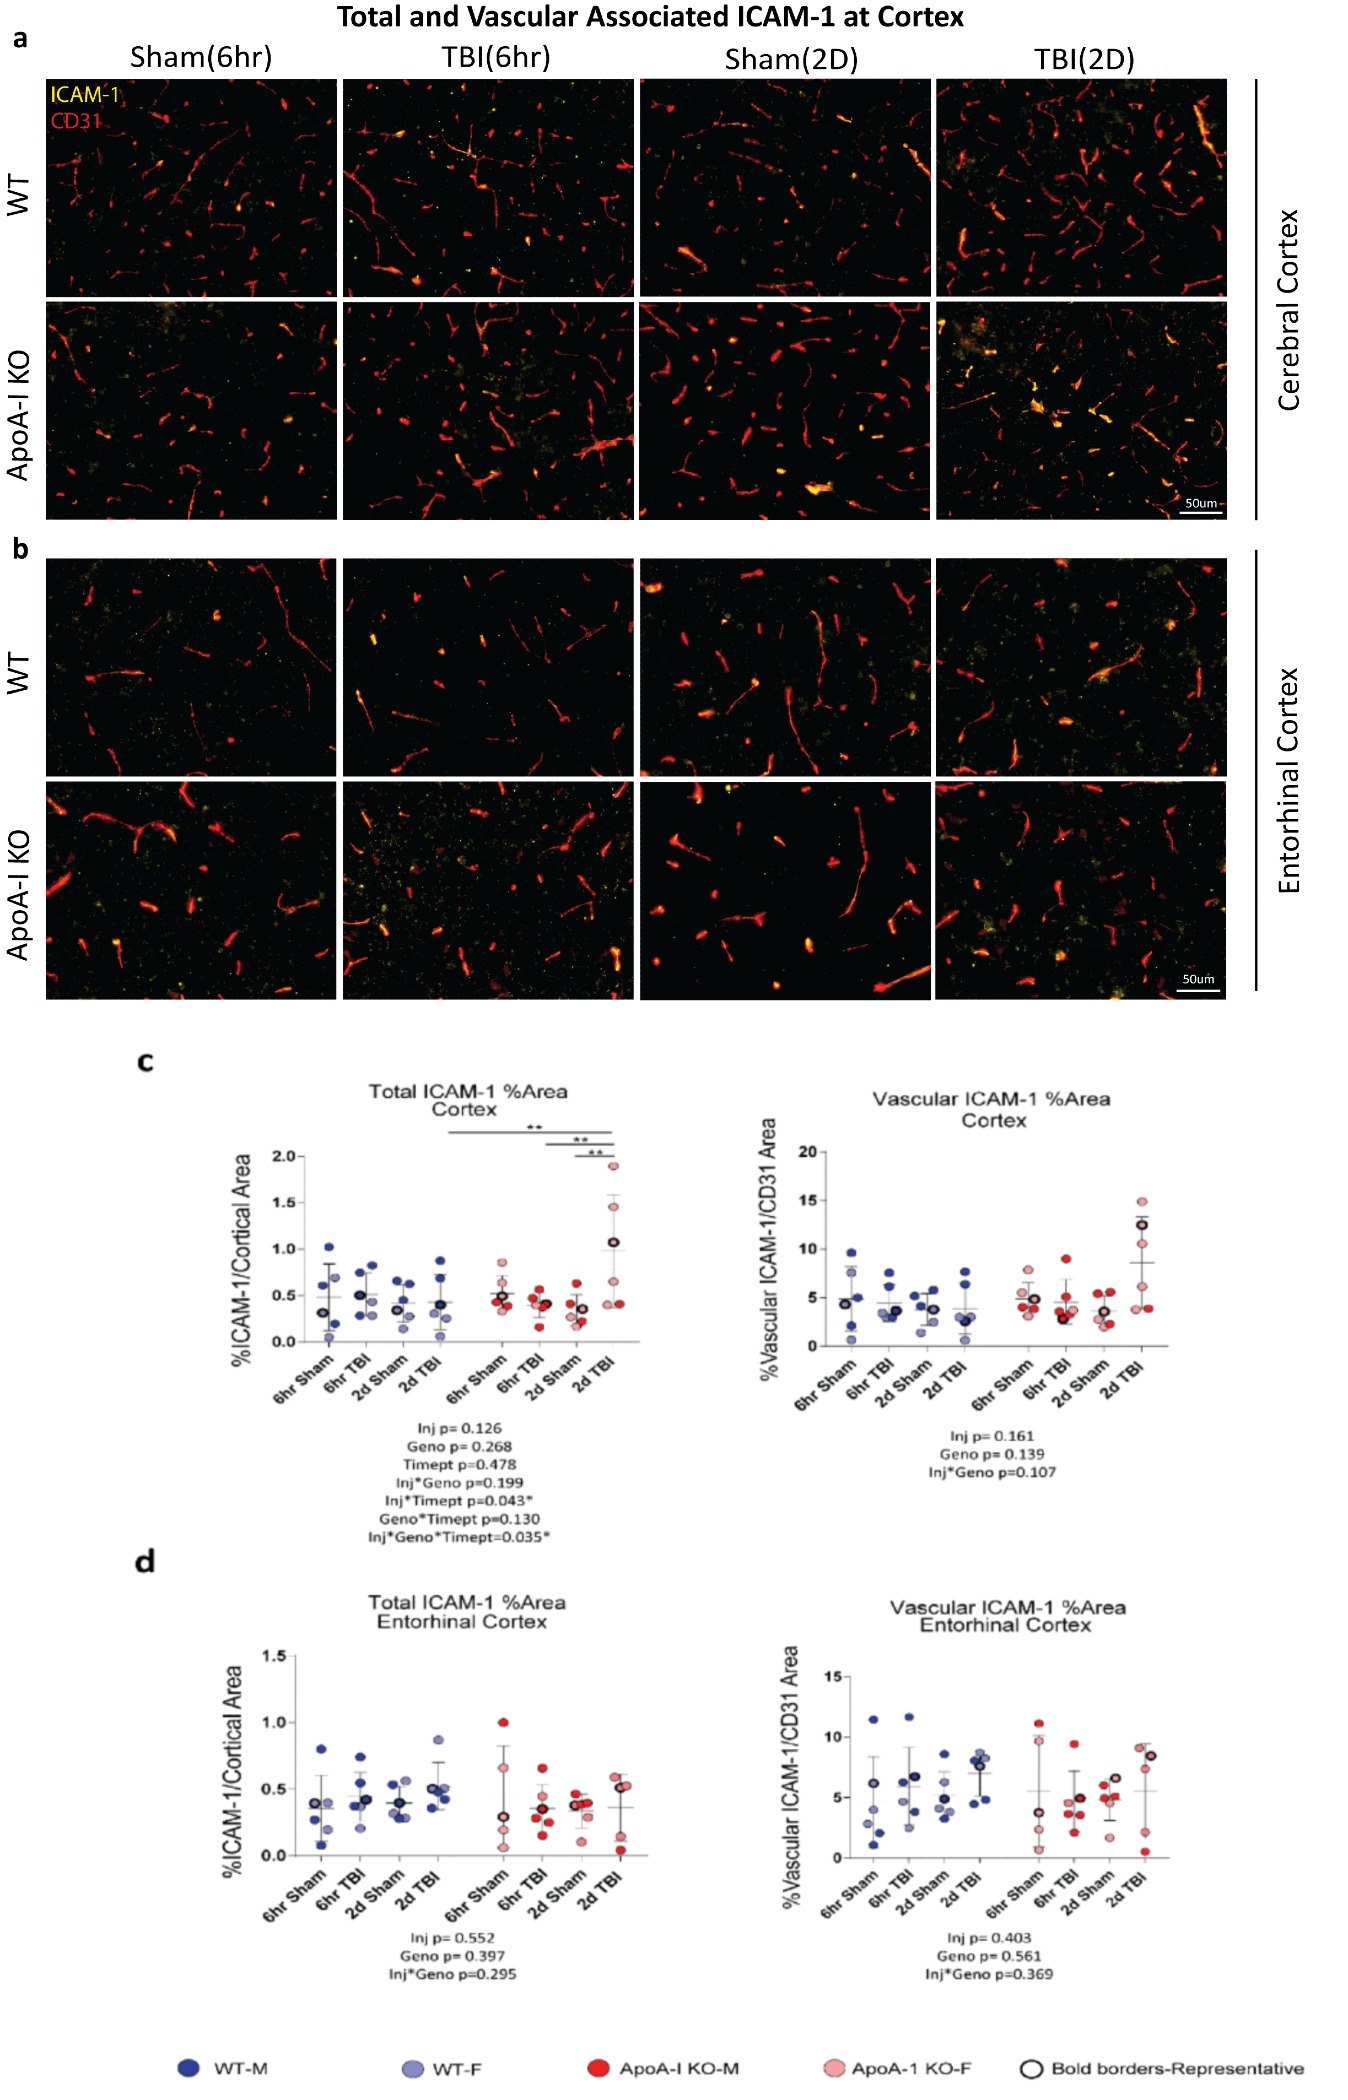
Fig. 4 TBI Induced increased Total ICAM-1 expression at the cerebral cortex in ApoA-I KO animals at 2D post Injury. ICAM-1 expression in the brain vasculature was assessed by ICAM1 and CD31 co-staining at 6hr and 2D post-TBI. (a)(b) Coronal sections showing total ICAM1 positive signal and CD31 associated ICAM-1 signal in the cortex of the anterior hippocam‐ pus section and entorhinal cortex respectively (c)(d) Quantitative analysis of ICAM-1 staining at the Cortex of the anterior hippocampus and entorhinal cortex respectively. Stained images were quantified by calculating the % of the region of interest (ROI) that were ICAM-1 positive. Vascular ICAM-1 was reported as the ea of ICAM-1 directly overlapping with CD31 signal, normalised to CD31 Area within ROI. Cohort Size: N=6 for all groups, except for the ApoA-I KO-6hr Sham group and the ApoA-I KO-2D TBI group in the entorhinal cortex where N=5. Circles with bold borders in (c)(d) correspond to the representative images shown in (a)(b). Data in (c)(d) were analyzed by 3- Way ANOVA, followed by Sidak post-hoc test. In (c), * indicate a significant post-hoc injury effect within a specific timepoint and genotype, a significant timepoint effect within a specific genotype and injury status, or a significant genotype effect within a specific timepoint and injury status (* p < 0.05, ** p < 0.01, *** p < 0.001).