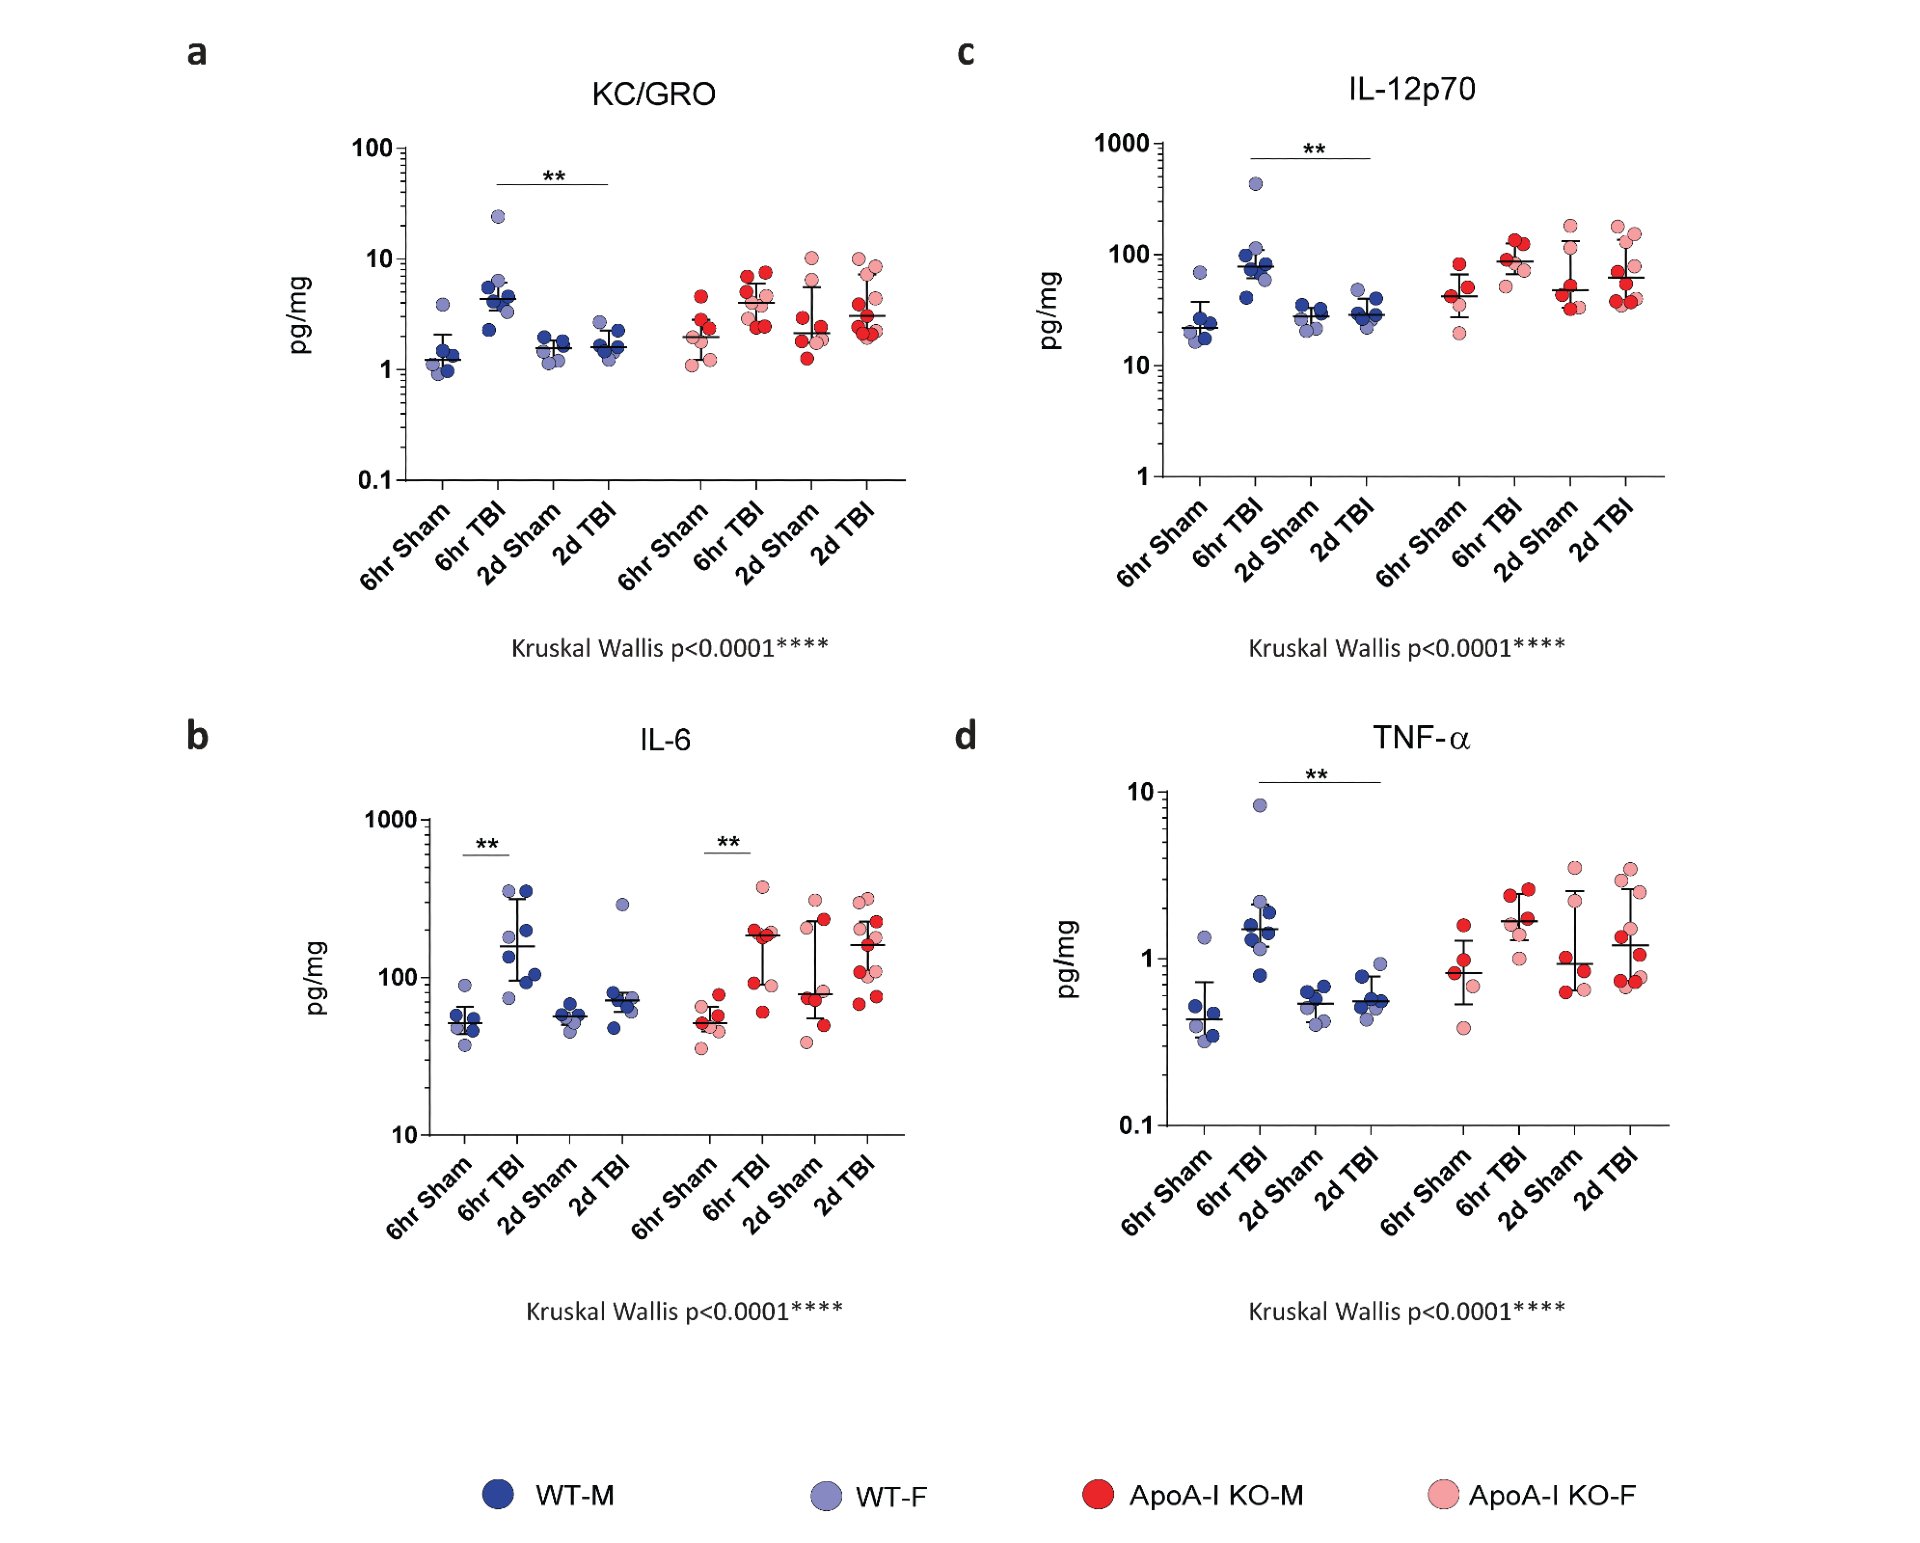
Fig. 3 Altered cytokine profiles in ApoA-I KO animals. Inflammatory cytokine levels were assessed by ELISA at 6hr and 2 day (2D) timepoints post-TBI. Cytokine analysis of (a)KC/GRO, (b)IL-6, (c)IL-12p70, (d)TNF-α levels in half brain lysates normalised to protein concentrations respectively. For KC/GRO and IL-6, Cohort Size: WT-6hr (Sham:N=6, TBI:N=8); WT-2D(Sham:N=6 , TBI:N=7); ApoA-I KO-6hr (Sham:N=7, TBI:N=9); ApoA-I KO-2D (Sham:N=8 , TBI:N=11). For IL-12p70 and TNF-a, Cohort Size: WT-6hr (Sham:N=6, TBI:N=8); WT-2D(Sham:N=6 , TBI:N=7); ApoA-I KO-6hr (Sham:N=5, TBI:N=6); ApoA-I KO-2D (Sham:N=6, TBI:N=10). In all graphs, error bars indicate Median± IQR, y-axis are in log base 10 scale. Light col‐ oured circles indicate female animals and dark coloured circles indicate male animals. All data are analyzed by Kruskal-Wallis test for overall significance, followed by Bonferroni corrected Mann-Whitney U post-hoc analysis. * in‐ dicate a significant post-hoc injury effect within a specific timepoint and gen‐ otype or a significant genotype difference within a specific timepoint and in‐ jury group (* p < 0.05, ** p < 0.01, *** p < 0.001).