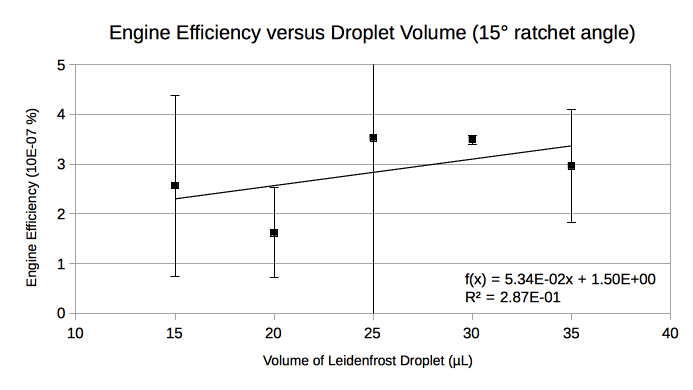
Fig. 5 Engine efficiency versus droplet volume for Slab 2 (see Table 1). Error bars represent standard deviation. Sample size is n=3 for 15, 20, 25, & 35 µL and n=6 for 30 µL. A least-squares fit was performed to determine the linearity of the relationship.