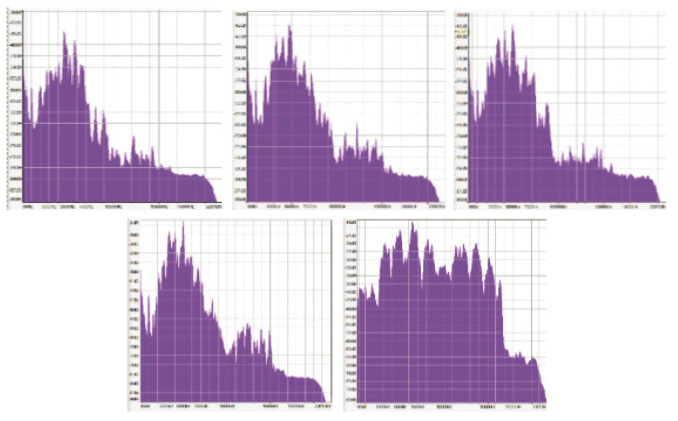
Fig. 3 Intensity graphs of white noise propagated
through various media; from top left to bottom right,
the materials are Material 2, Material 1, Material 3, Material 4, and the control (‘lidless’) trial; frequency is plotted
on the x-axis, in s-1, and intensity is plotted on the y-axis,
in decibels; intensity not to scale.